
Figure 10. 5-HT reduces the frequency of spontaneous EPSCs.
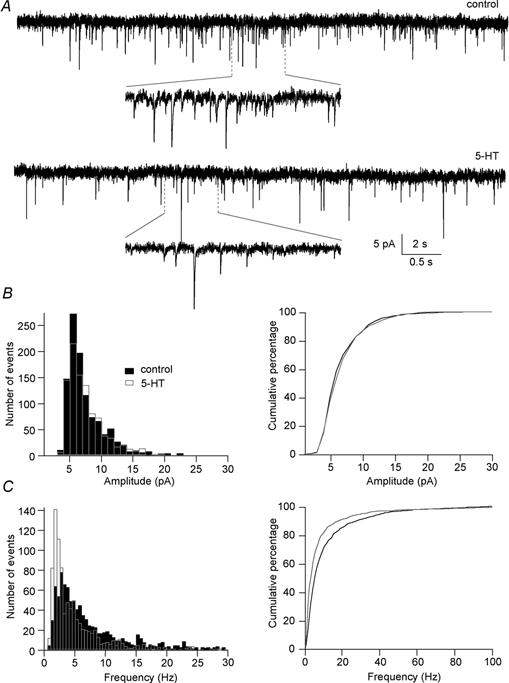
A, specimen miniature EPSCs recorded in the presence of 1 μm TTX and 5 μm strychnine (control) and with the addition of 30 μm 5-HT (5-HT). The holding potential was -70 mV. B: left, amplitude histogram of mEPSCs recorded in control (filled bars) and 5-HT (open bars) from the same cell as in A showing that 5-HT did not change the mean mEPSC amplitude (6.6 ± 0.1 pA in control and 6.7 ± 0.1 pA in 5-HT, P= 0.05, two sample Kolmogorov-Smirnov test). Right, cumulative probability plot of the amplitude of mEPSCs showing that the two distributions overlaped. C: left, frequency histogram of mEPSCs recorded in control and 5-HT from the same cell as in A showing that 5-HT significantly reduced mean mEPSC frequency (11.1 ± 0.5 Hz in control to 7.5 ± 0.4 Hz in 5-HT, P < 0.001, two sample Kolmogorov-Smirnov test). Right, cumulative probability plot of the frequency of mEPSCs showing the significant reduction in mean mEPSC frequency.