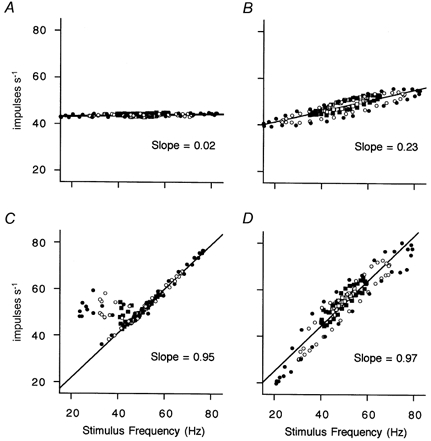
Figure 5. Effects of varying the depth of frequency modulation.

A, C and D are from the γs to primary afferent pairings shown in A, C and E, respectively, in Fig. 4, whilst B is a different γs-axon activating the same primary afferent as in A. Mean stimulus frequency is 50 Hz and modulation depths are ± 5 (□), 10 (▪), 20 (○) and 30 Hz (•). Straight lines are linear regressions fitted to all the data points, except in C, in which the outlying points occurring at low stimulus frequencies have been omitted from the calculation of the regression (slopes are shown inset).
