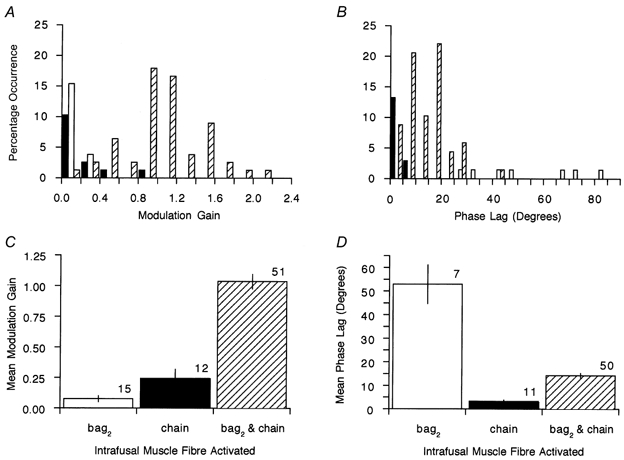
Figure 6. Summary of modulation data for the three types of γs action.

Distribution of values of modulation (A) and distribution of values of modulation phase lag (B) at 1 Hz for pure bag2 (□), pure chain (▪) and mixed bag2 and chain ( ) effects. C, values of mean modulation gain for the three types of γs action. D, mean values of phase lag for the three types of γs action. In C and D, the numbers above the bars are the number of data values and the error bars are ±s.e.m.
