
Figure 2. Presynaptic stimulus intensity affects the magnitude of DSI.
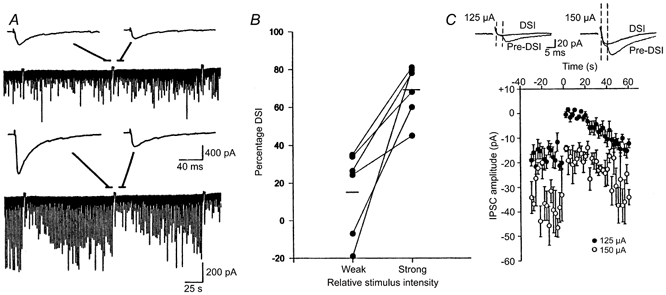
A, in this cell, with a relatively weak stimulus intensity (175 μA), the IPSCs were small, and there was little evidence of DSI following the voltage step (upper trace). The insets represent the mean of five IPSCs before and during the DSI period. When the stimulus intensity was increased (200 μA), much larger IPSCs were evoked and DSI was greatly enhanced (lower trace). B, data from six cells, showing an increase in DSI with higher stimulus intensities. Lower stimulus intensities (75-175 μA) produced 43-220 pA mean eIPSC amplitudes, whereas higher stimulus intensities (150-500 μA) elicited 215-2040 pA eIPSCs. The mean DSI values, shown by the horizontal lines, increased substantially. C, weak stimulation intensities reveal susceptible and non-susceptible eIPSCs. Stimulus intensity was adjusted to produce small, quantal-sized IPSCs and occasional failures of transmission. S. radiatum was stimulated at 0.5 Hz. At 125 μA, minimal eIPSCs were consistently elicited, as shown by the mean of 10 IPSCs occurring before the depolarizing voltage step (Pre-DSI). During the DSI period, most of the stimuli resulted in failures, as indicated by the mean of 10 sweeps shown (DSI). Increasing the stimulus intensity to 150 μA resulted in the recruitment of another component with a shorter latency that was not susceptible to DSI, although the later component still failed during DSI. Stimulus artifacts were reduced for clarity. The graph shows summary data for this cell. DSI of the peak eIPSC amplitude was apparent at the higher stimulus intensity, but could be accounted for by the reduction of the low threshold component alone.