
Figure 6. Overlapping effects of BMI and apamin on membrane potential properties.
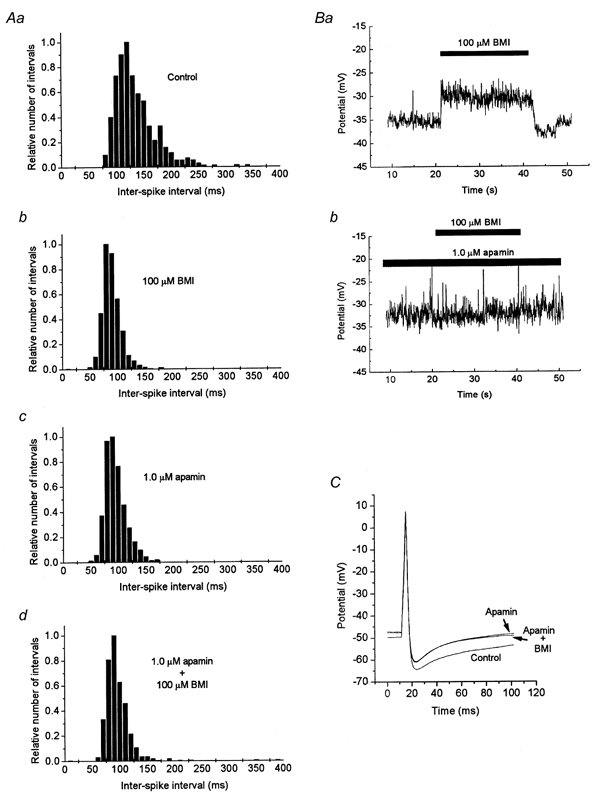
A, distribution of inter-spike intervals from a spontaneously firing neuron in control solution (Aa), and in the presence of BMI and/or apamin as indicated (Ab-d). Note the similarly changed distribution with a higher proportion of shorter intervals with either BMI, apamin or both drugs present. B, a change in resting potential is induced when 100 μm BMI is added to the standard extracellular solution (Ba), but no further change is induced when BMI is added to a solution containing 1 μm apamin (Bb). C, impulses evoked by a 70 pA, 4 ms stimulus current in control solution (lower trace), in a solution with 1 μm apamin and in a solution with 1 μm apamin as well as 100 μm BMI, as indicated. Note that the two latter curves are separable only at the end of the traces, since BMI gave no additional effect when applied to the apamin-containing solution. Different cells were used for A–C.