
Figure 1. Steady-state I-V relations without  and high .
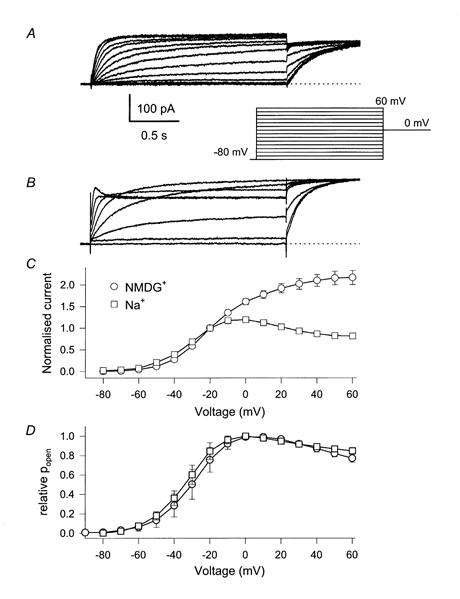
Whole-cell currents were measured using the pulse protocol indicated in the inset. A, no Na+ in the intracellular solution; B, 65 mm[Na+]i. For clarity only every second current trace is displayed. In C, the steady-state I-V relation is plotted, measured at the end of the variable test pulse averaged over at least 6 cells for each condition (error bars indicate s.e.m and are smaller than the symbols for some values). The values are normalised to the current measured at -20 mV. In D, the initial current at the start of the constant tail pulse to 0 mV was normalised to the maximum value (usually around -10 mV), averaged over several cells (n > 5 for each condition) and plotted versus the prepulse potential. Error bars in D indicate s.d.