
Figure 3. Instantaneous Na+ block after long prepulses.
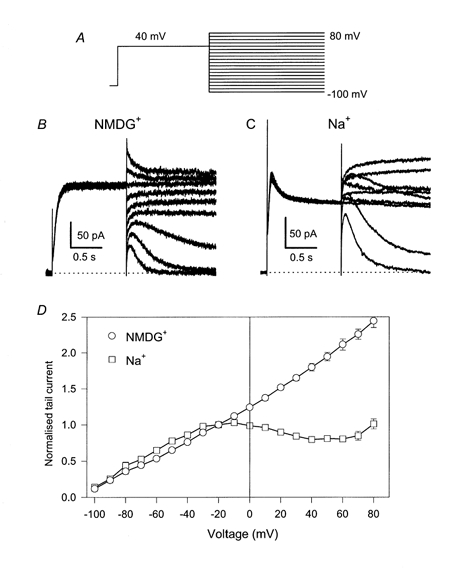
Tail currents were measured with a pulse protocol indicated in A. Typical families of traces are shown in B (no [Na+]i) and C (65 mm[Na+]i). For clarity every other current trace is displayed. In D averaged initial tail currents normalised to the value measured at -20 mV are plotted as a function of the tail voltage, Vt. Error bars indicate s.e.m. (n≥ 5) and are smaller than the symbols for some values.