
Figure 4. Partial relief of Na+ block in 20 mm extracellular K+ and Na+ block in physiological K+.
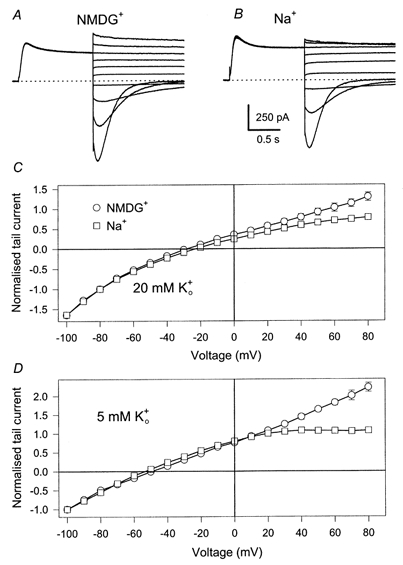
Tail currents (A: no [Na+]i, B: 65 mm[Na+]i) were measured as in Fig. 3 with an extracellular solution in which 20 mm Na+ was replaced by K+. For clarity every other current trace is displayed. In C averaged instantaneous currents are plotted as a function of the tail voltage, normalised to the value measured at -100 mV (error bars indicate s.e.m. (n≥ 4) and are smaller than the symbols for some values). D shows plots of averaged instantaneous I-V relations measured in a solution in which 5 mm Na+ was replaced by K+ (n≥ 4 for each condition).