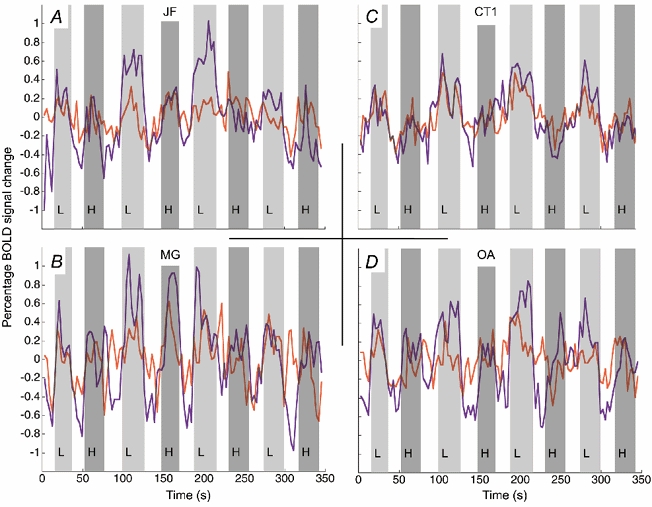
Figure 2. Time course of BOLD signal change for amblyopic (red) and fixing eye (purple) stimulation for four subjects.

The light and dark grey bars indicate the presentation of low (L) and high (H) spatial frequency stimuli, respectively; the bars have been delayed in time by 6 s in order to coincide with the time-lagged haemodynamic response. The open bars show the blank stimulus condition where no grating stimuli were presented. Time series were created using the voxels identified as significantly active from the average response of both eyes to the low spatial frequency stimulus. Note that in all subjects except CT the response for amblyopic, as compared to fixing eye, stimulation was reduced.
