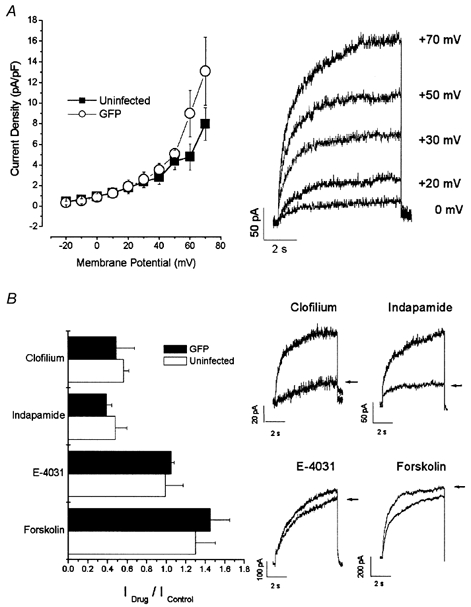
Figure 2. IKs in neonatal mouse myocytes.

A, current-voltage (I-V) relationship (left panel, ▪) and raw records of a family (right panel) of IKs recorded from uninfected myocytes using the perforated-patch technique. B, left, the effects of 100 μm clofilium, 1 mm indapamide, 10 μm E-4031 and 10 μm forskolin + 100 μm IBMX (Forskolin) on the current amplitude of IKs were normalized to those measured under drug-free conditions and plotted as bar graphs (□). Right, typical IKs currents recorded before and after (arrows) application of these drugs. I-V relationships (left panel of A, ○) and pharmacology (left panel of B, ▪) of IKs recorded from AdRGI-infected cells are also shown.
