
Figure 3. Emergence of group I EPSPs in two gastrocnemius motoneurones following administration of l-DOPA (A) and during MLR-induced fictive locomotion (B and C).
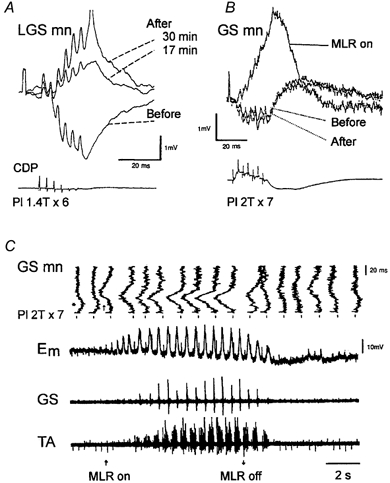
A, upper panel, superimposed traces are averaged intracellular records whereas the lower trace shows a sample of the cord dorsum potentials. The intracellular traces show the response to a train of stimuli of the plantaris nerve (Pl; 1.4 T) before, 17 and 30 min after injection of l-DOPA. B, upper traces, superimposition of averaged responses to the group I stimulation, obtained before, during and after the locomotor period. The lowermost trace is the cord dorsum potential aligned with the averaged intracellular responses. C, top to bottom: (1) high gain intracellular responses in a gastrocnemius-soleus motoneurone to group I stimulation of the plantaris nerve tilted vertically (GS mn). These are expended periods (100 ms) obtained from (2) the slow low gain intracellular record displaying the locomotor drive potentials (Em), and the electroneurograms from (3) the gastrocnemius-soleus nerves (GS) and (4) the tibialis anterior nerve (TA). The periods of the slow time base recordings, which are expanded in the upper vertical traces, are indicated by markers above the continuous recording. The group I stimulation coincides with the beginning of the fast vertical traces (as indicated in B). The beginning and the end of a period of continuous MLR stimulation are indicated at the bottom. (Modified from Gossard et al. 1994.)