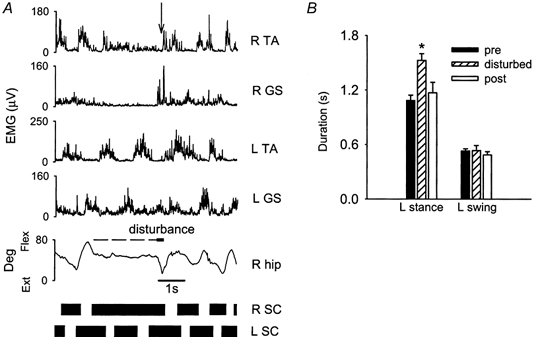
Figure 3. Response to rapid extension of the right hip during contralateral late stance phase.

A, response from a single subject (GW). Muscle activity from surface electromyography (EMG), right hip angle (R hip) and step cycle (SC) of both legs before, during and after the disturbance. The horizontal dashed line between the 4th and 5th trace represents the time when the right leg was held in a mid-stance position before rapid hip extension (thick horizontal line) was applied. The black bars at the bottom of the graph represent the stance phase whereas the spaces between the black bars represent the swing phase. The same figure convention is used in Figs 4, 6 and 7. Swing initiation on the right side occurred when the left leg was still in stance phase (see arrow in R TA signal). B, average duration of the left stance and left swing phase for the steps preceding, during and following the disturbance (pooled across data from 9 subjects). The error bars represent one standard error. * Statistically significant difference compared with the step preceding the disturbance
