
Figure 1. Estimating the time course of Ca2+ release in myotubes using fura-2 fluorescence transients.
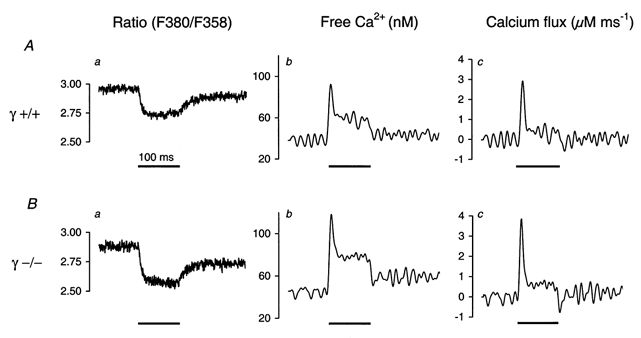
A, ratio F380/F358 of single fura-2 fluorescence signals obtained at a 100 ms depolarization to +20 mV (horizontal bar) in a γ+/+ myotube (a), calculated free Ca2+ after correction for the indicator time response (b) and Ca2+ input flux (c) (see Results and Methods). B, corresponding calculations for a γ–/– myotube.