
Figure 4. Contractile activation in fast and slow twitch muscles.
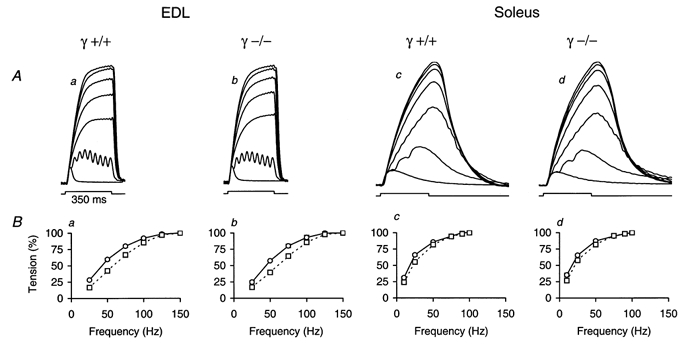
A, single twitches and contractions measured at different stimulation frequencies in EDL (a and b) and soleus muscle (c and d). Example recordings of γ+/+ (a and c) and γ–/– muscles (b and d) are shown. The rectangular signal below the traces shows the time interval of 350 ms in which repetitive stimulation was activated. Frequencies of 25, 50, 75, 100, 125 and 150 Hz were applied in EDL and of 10, 25, 50, 75, 90 and 100 Hz in soleus. The signals were normalized to the maximum. The maximal force values were 141 mN (a), 194 mN (b), 101 mN (c) and 74 mN (d). B, force-frequency relations derived from recordings similar to those shown in A. The normalized mean force values at the end of the stimulation period are plotted. In both γ+/+ and γ–/–, experiments were carried out on 4 EDL (a and b) and 3 soleus (c and d) muscles. The error bars indicating s.e.m. are smaller than the symbol sizes. ○, measured before fatigue; □, measured after stimulation leading to fatigue (tetanus amplitude 30 % of original value in EDL and 50 % in soleus, see Fig. 5) and a subsequent 30 min recovery interval. The mean values of the frequency that generated half-maximal force (F1/2) were 42.47 ± 1.01 Hz (γ+/+, n = 4) vs. 44.31 ± 0.71 Hz (γ–/–, n = 4) for EDL and 18.17 ± 0.73 Hz (γ+/+, n = 3) vs. 17.21 ± 1.19 Hz (γ–/–, n = 3) for soleus. After fatigue and 30 min recovery the corresponding values were 57.90 ± 1.89 Hz (γ+/+) vs. 60.29 ± 2.08 Hz (γ–/–) for EDL and 22.50 ± 0.79 Hz (γ+/+) vs. 21.39 ± 1.79 Hz (γ–/–) for soleus.