
Figure 5. Fatigue in fast and slow twitch muscle.
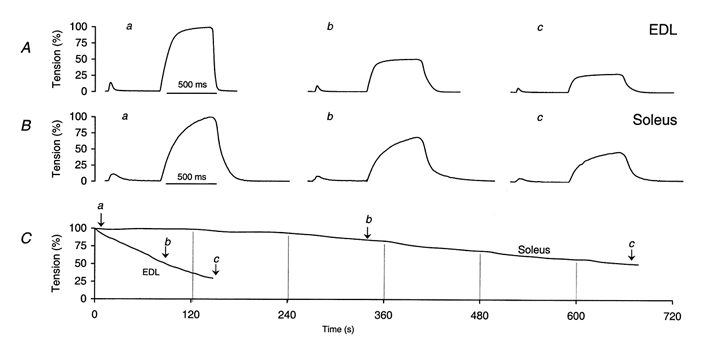
Examples of twitch and tetanus recordings in EDL (A) and soleus (B) at different times during fatigue stimulation (see text for details). C, amplitude change of tetanic contraction in EDL and soleus plotted against time to exemplify fatigue runs. a, b and c indicate the times when the signals shown in A and B were recorded. Vertical lines indicate times when the tetanus repetition rate was increased (see text for details).