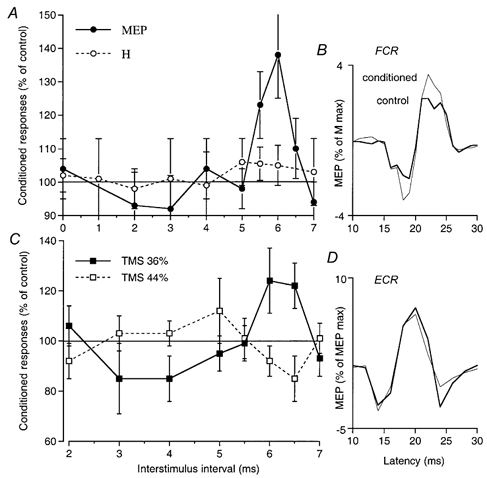
Figure 1. Time course of effects of musculo-cutaneous volleys on the MEPs of FCR and ECR.

Data from single subjects co-contracting FCR (A and B) or ECR (C and D, another subject) and biceps. A, comparison of the time courses of the effects of musculo-cutaneous volleys (0.75 × MT) on the MEP (•, TMS intensity 35 %) and the H reflex of FCR (○). The sizes of the MEP and the H reflex (both adjusted to be approximately 5 % of the maximal M wave, and each expressed as a percentage of its control value) are plotted against the ISI (2 ms has been subtracted from the ISI between conditioning and test H reflex volleys so that the appropriate intervals are aligned, see Methods). B, mean control and conditioned (facilitated) FCR MEPs (20 sweeps, thick and thin lines, respectively, expressed as a percentage of the maximal M wave) at the 5.5 ms ISI (another experiment – in which MEP facilitation started at the 5 ms ISI – in the same subject as in A). C, time courses of musculo-cutaneous (0.75 × MT) effects on the MEP of ECR using two TMS intensities, 36 (▪) and 44 % (□). D, mean control and conditioned (inhibited) ECR MEPs using TMS at 44 % (20 sweeps, thick and thin lines, respectively, expressed as a percentage of maximal MEP) at the 6.5 ms ISI. Error bars in A and C, 1 s.e.m.
