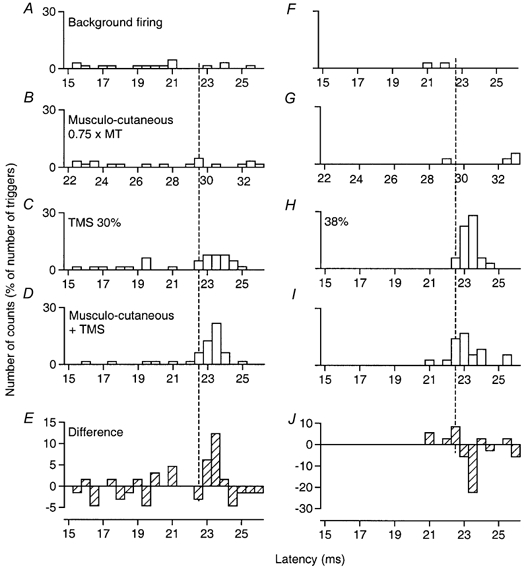
Figure 4. PSTHs of a motor unit in FCU: effects of musculo-cutaneous volleys on corticospinal excitation at two TMS intensities.

Co-contraction of FCU and biceps. Musculo-cutaneous volleys at 0.75 × MT, 7 ms ISI. In this and subsequent figures, the number of counts in each bin (expressed as a percentage of the number of triggers) is plotted against the latency after TMS (except in B and G, where the abscissa is the latency after musculo-cutaneous stimulation). A and F, background firing of the unit in the absence of TMS and peripheral stimuli. B and G, effects of musculo-cutaneous volleys given alone. C and H, corticospinal excitation produced by TMS at 30 % (C) and 38 % (H). D and I, effects of musculo-cutaneous volleys on the corticospinal excitation: facilitation at 30 %, inhibition at 38 %. E and J, the difference between the effect on combined stimulation (D and I) and the sum of the effects of separate stimuli (B + C and G+H, respectively). The vertical interrupted line indicates the first bin (22.5 ms) of the peak of cortical excitation, which was spared by both facilitation (E) and inhibition (J).
