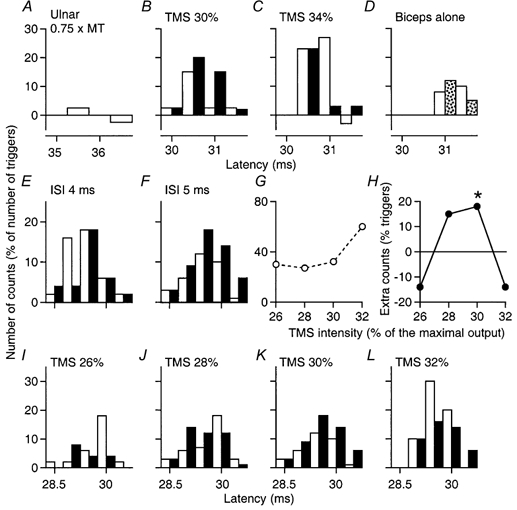
Figure 5. PSTHs of two motor units in biceps: effects of ulnar volleys at different TMS intensities.

Ulnar stimulation at 0.75 × MT. A-D, unit 1, during co-contraction of biceps and FCU (A–C) and during selective contraction of only biceps (D). In this and subsequent figures, the background firing has been subtracted; the control responses (open bars) and the conditioned responses (filled bars, or speckled bars in D) are plotted against the latency after TMS (except in A, where the abscissa is the latency after ulnar stimulation). A, lack of effect of ulnar stimulation by itself on discharge probability. B and C, facilitatory and inhibitory interactions (ISI, 5 ms), respectively, between the ulnar and corticospinal volleys produced by varying TMS intensity (30 % in B and 34 % in C). D, absence of ulnar facilitation using TMS 30 % and the same ISI when only biceps was contracting. E–L, responses of unit 2 during co-contraction of biceps and FCU. E and F, ulnar facilitation of the corticospinal response (TMS, 30 %) with an ISI of 5 ms (F) but not at 4 ms (E). G and H, the unconditioned corticospinal peak (G) and the difference between conditioned and control peaks (H), measured from 29 to 30.5 ms because the first bin was spared by ulnar-induced effects, are plotted against the intensity of TMS (5 ms ISI). The asterisk in H indicates P < 0.05. I–L, effects of increasingly strong TMS on the ulnar-induced effects (5 ms ISI): facilitation at 30 % (K), inhibition at 32 % (L). Note the sparing of the initial bin of the histograms in B, C, F and J–L.
