
Figure 3. Original recordings of field potentials and cerebral blood flow in response to different frequencies of stimulation.
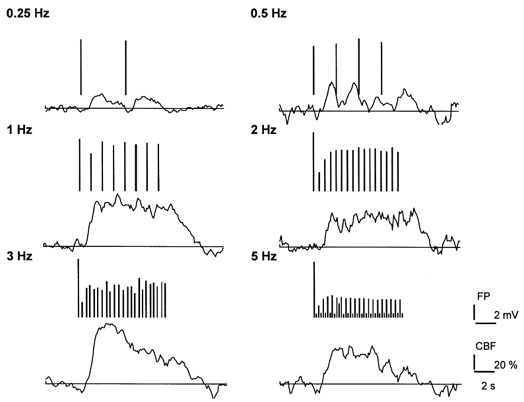
Extracellular field potentials (FP) and cerebral blood flow (CBF) in response to variations in stimulus frequency, at a stimulus duration of 8 s, and an intensity of 1.5 mA. The figure shows transformed original records of CBF and FP responses at 6 different frequencies. CBF was measured at an approximate depth of 500–1000 μm and FP at a depth of 700 μm. FP amplitudes are represented by the length of vertical lines above CBF traces that are plotted for each frequency.