
Figure 5. Laminar analysis of timing and magnitude of increases in cerebral blood flow in relation to stimulus onset.
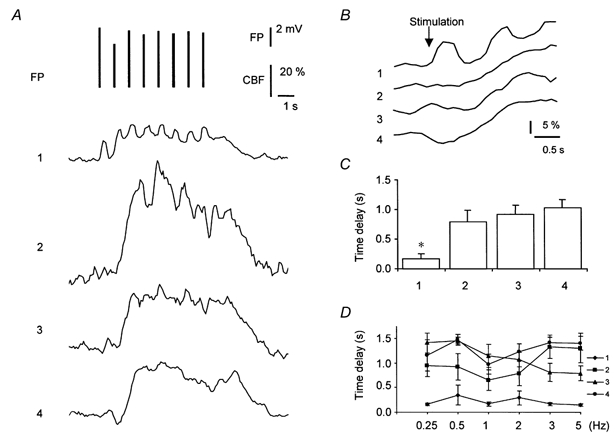
A, transformed original data showing changes in cerebral blood flow (CBF) and field potential amplitude (FP) evoked by electrical simulation for 8 s at 1 Hz and 1.5 mA. Upper panel shows FP amplitudes represented by the length of the vertical line. Lower 4 panels show the CBF responses corresponding to depths of 0–250 μm (1), 250–500 μm (2), 500–1000 μm (3) and 1000–2000 μm (4). First and last FP mark start and end of stimulation, respectively. CBF responses to single stimuli were evident in the upper 0–250 μm of the cortex. B, CBF increases in the 4 layers on an extended time scale showing that the CBF rise started in the upper 250 μm of the cortex. Latencies were 0.2, 1.0, 1.1 and 1.7 s in layers 1-4, respectively. This pattern was found in every single animal. C, mean latency of onset of CBF rise at four cortical depths for all animals (n = 6). The latency was significantly shorter at 0–250 μm (*P < 0.05) than for the 3 lower layers. D, mean latency of onset of CBF rise as a function of stimulation frequency. The CBF increase always started in the uppermost cortical layers independently of stimulation frequency (n = 6).