
Figure 4. Slopes of performance for all stimulus conditions.
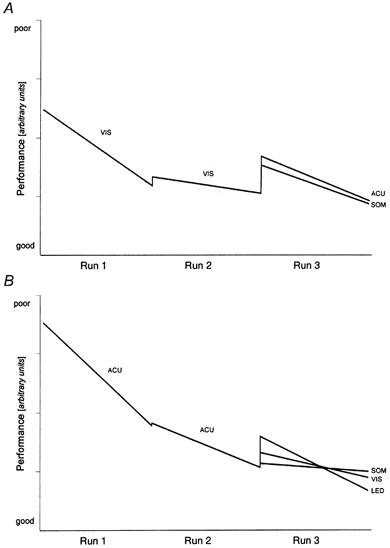
Linearized learning slopes averaged over all variables per condition. The slopes are proportional to the mean correlation coefficients listed in Table 1. The steps between the consecutive runs are proportional to the mean CMT listed in Table 2. A, stimulus sequences VIS-VIS followed by SOM or ACU. B, sequences ACU-ACU followed by VIS, SOM or LED. See Methods for the definition of performance.