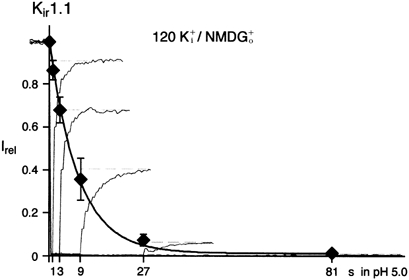
Figure 3. Time course of K+-dependent inactivation.

Time course of K+-dependent inactivation monitored by the current recovery as obtained from experiments as in Fig. 2B. K+i at pH 5.0 was applied for periods of 1, 3, 9, 27 and 81 s. Overlaid are current traces from such experiments normalized to the initial outward current amplitude at pH 8.0 (only currents at 40 mV are shown); data points are means ±s.d. of 5 experiments. Line is monoexponential fit to the data that yielded a time constant of 8.2 s.
