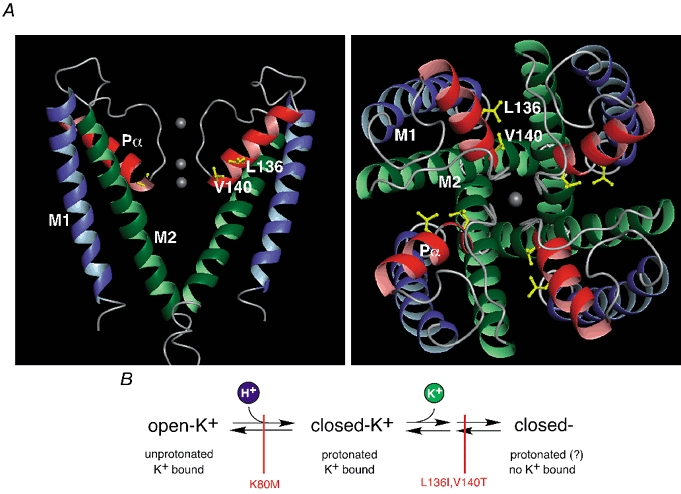
Figure 7. Structural model of the KcsA pore and sequential model of Kir1.1 gating by pHi and K+o.

A, structural model of the KcsA pore as determined by X-ray crystallography (Doyle et al. 1998) viewed from the side (left panel, only two subunits shown for clarity) and the top (right panel); transmembrane segments in green (M1) and blue (M2) and the P-helices (Pα) in red; K+ binding sites are indicated by grey spheres. Side chains of residues 70 and 74 homologous to residues 136 and 140 in Kir1.1 were replaced by I and V and highlighted. Note that the side chains are oriented towards the neighbouring subunits rather than to the ion conducting pathway. B, sequential model of Kir1.1 gating by pHi and K+o as deduced from the experiments presented here. ‘open-K+’ represents active channels; ‘closed-K+’ is pH-inactivated closed state with K+ bound to the pore binding site(s); ‘closed-’ is K+-inactivated closed state; possible intermediate states are omitted for simplicity. These channel conformations are linked through gating transitions (pH gating and K+-dependent gating, symbolized by arrows) which can be blocked independently by point mutations (indicated in red).
