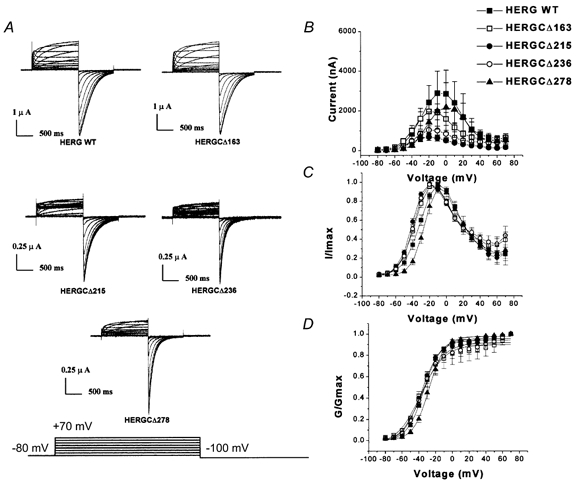
Figure 2. I-V and G-V relationships of HERG C-terminal deletion mutants.

A, current traces recorded from HERG C-terminal deletion mutants. In these experiments cells were held at −80 mV and voltage commands were given from −80 to +70 mV for 1 s in steps of 10 mV and each step was followed by a step to −100 mV. B, peak amplitude I-V plots for HERGCΔ163 to HERGCΔ278 (symbols are indicated in figure). Deletion of amino acid residues from the C-terminus reduced the amplitude of HERG currents. One-way ANOVA showed that the mean currents of these constructs at each voltage were significantly different at the 0.05 level (n = 24, P = 0.0023). Deletion of more than 300 amino acid residues from the C-terminus resulted in no detectable current. C, normalized I-V plot for HERGCΔ163 to HERGCΔ278. D, normalized G-V plot for HERG C-terminal deletion mutants. Deletion of amino acid residues from the C-terminus of HERG had little effect on the slope of the steady-state activation curve. Slope (mV, mean ±s.e.m.) and V1/2 (mV, mean ±s.e.m.) values were 10.1 ± 0.7, −33.9 ± 0.8 for WT; 14.3 ± 2.1, −37.9 ± 2.6 for HERGCΔ163; 11.1 ± 1.0, −36.5 ± 1.2 for HERGCΔ215; 13.3 ± 1.8, −36.1 ± 2.1 for HERGCΔ236; and 9.5 ± 0.46, −27.7 ± 0.5 for HERGCΔ278. One-way ANOVA showed that the voltage dependences were not significantly different at the 0.05 level (n = 16 for each construct, P = 0.999).
