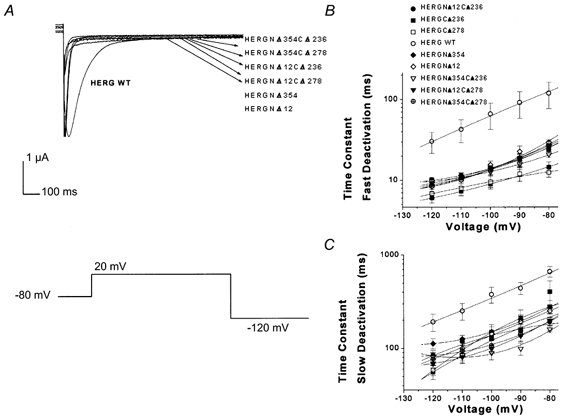
Figure 6. Deactivation kinetics of double-deletion mutants.

Deactivation in double-deletion mutants was not faster than in individual N-terminal and C-terminal deletion mutants. A, deactivation current traces from HERG C-terminal, N-terminal and double-deletion mutants. In this set of traces cells were held at −80 mV, depolarized to +20 mV for 1 s and subsequently hyperpolarized to −120 mV for 3 s. B, plot of fast deactivation time constants versus voltage for C-terminal, N-terminal and double-deletion mutants. Symbols for plots are indicated in the figure (n = 16, P = 0.383). C, plot of slow deactivation time constants versus voltage for C-terminal, N-terminal and double-deletion mutants. Symbols as in B (n= 16, P = 0.773).
