
Figure 4. Autocorrelation analysis of the sustained and oscillatory spike patterns.
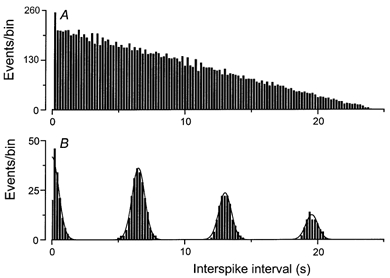
Autocorrelation functions derived from the spike trains evoked by a 30 s odour exposure in the cell of Fig. 2 (300 μm trace), which exhibited a sustained response pattern (A) and in the cell of Fig. 3 (50 μm trace), which exhibited an oscillatory response pattern (B). For each trace the time interval was calculated between each pair of spikes, and these events plotted as a function of interspike interval with a binwidth of 0.2 s (see Methods). Events corresponding to the correlation of each spike with itself at zero interval have been excluded. The autocorrelation function of B has been fitted with multiple Gaussian curves, centred at 0, 6.5, 13.0 and 19.6 s using a least-squares algorithm.