
Figure 2. Effect of ADM on pre-capillary resistance (A), post-capillary resistance (B), and microvascular pressure (PC, C) in the spleen.
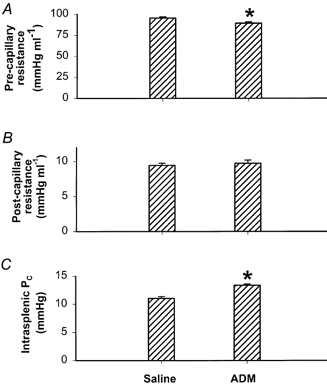
ADM was infused at a dose of 9 ng min−1. Error bars indicate s.e.m. *P < 0.05, significant difference between saline-infused (n = 5) and ADM-infused (n = 6) groups.