
Figure 3.
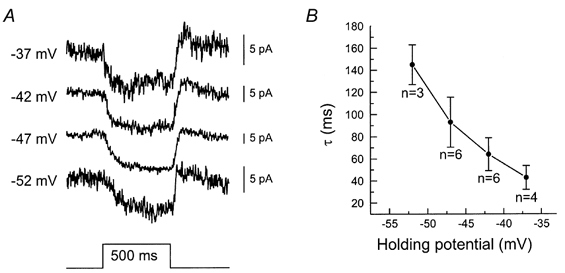
A, feedback responses of a voltage-clamped M-cone, which was continuously saturated with an intense white bright spot of 65 μm and, in addition, stimulated for 500 ms with a 3000 μm 550 nm spot. The clamp potentials of the cone are given to the left of the figure. An exponential function was fitted through these responses and the mean time constants are plotted as a function of holding potential in B.