
Figure 8.
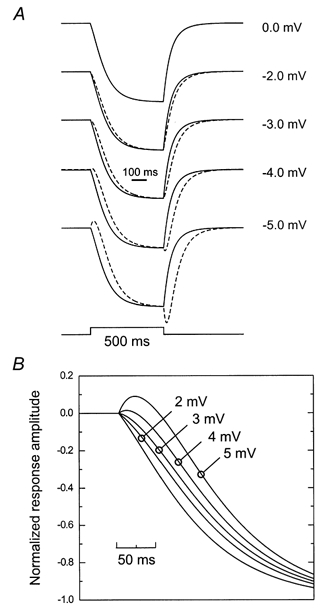
A, simulation of the feedback response in an M-cone for long wavelength stimuli. The time constant of the feedback signal in the cone is 80 ms and the time constant of the direct light response is 30 ms. The continuous trace is the change in Ca2+ current when the M-cone does not respond due to direct light stimulation (i.e. deep red light). The dashed traces are the changes in Ca2+ current when the M-cone responses have the amplitude indicated on the right of the figure. B, the onset of the change in Ca2+ current on an expanded time scale.