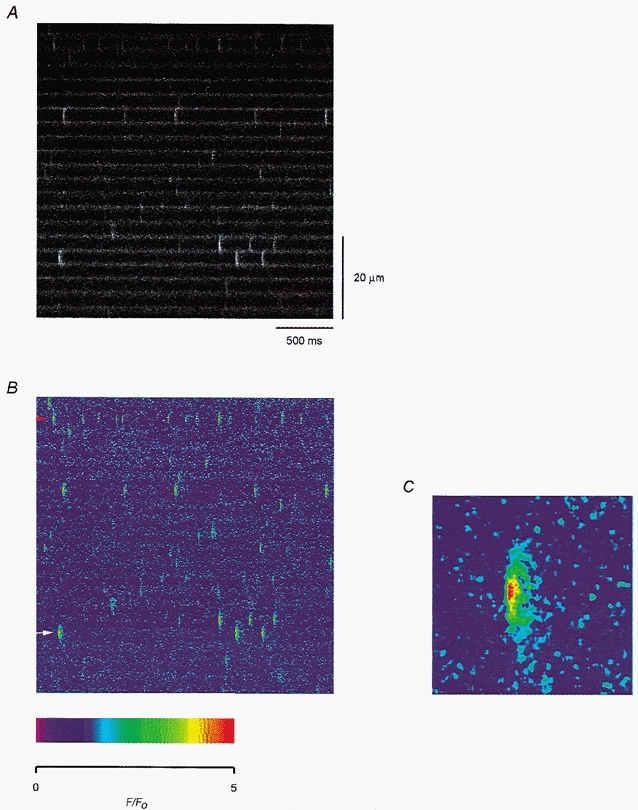
Figure 1. Spontaneous calcium sparks in a cut fibre.

A, fluorescence change recorded from a line placed longitudinally along a resting fibre. The time and distance scales are applicable to all the line-scan images in this report. B, pseudocolour image obtained after smoothing and executing the F-ratio procedure, as described in the text. The colour calibration is indicated by the scale below the image. C, magnified image of the bright spark (indicated by the white arrow) in the lower left corner of B. Fibre 1. Holding potential −90 mV. Sarcomere length 3.5 μm.
