
Figure 4. Time course of the increased ventilation at wake onset from sleep.
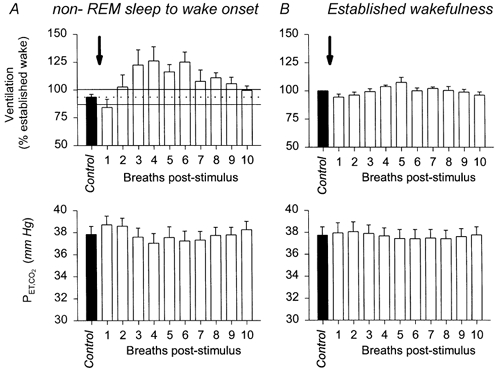
This figure shows group data (means ±s.e.m.) from five dogs. Ventilation is normalised in each dog to the average ventilation measured in established wakefulness (hence the absence of an error bar on the control values in B). A, transition from non-REM sleep to wake onset is associated with increased ventilation and transient reductions in Pa,CO2. The arrow shows the application of the auditory tone producing arousal from sleep. Filled columns indicate the grand mean of the 10 control breaths before the stimulus, and the open columns show the 10 experimental breaths following the auditory tone. The continuous and dotted lines show the mean ± 95 % confidence interval for the ventilation in non-REM sleep before arousal. Ventilation increases above sleeping levels on the second breath after wake onset. Also note that compared with established wakefulness the ventilation at wake onset from non-REM sleep exceeds the ventilation elicited by the same PET,CO2 levels when applied in steady-state established wakefulness (compare ventilation and PET,CO2 levels in A vs. B). B shows that application of the tone alone in established wakefulness caused no change in average ventilation and PET,CO2. See text for further details.