
Figure 4. Intracellular cAMP induces a positive shift in the voltage dependence of Ih activation.
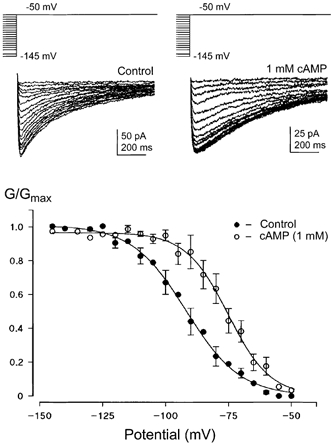
Activation curves were measured from Ih tail currents (as in Fig. 1) in different terminals with or without cAMP (1 mm) in the internal patch solution. Sample traces in different terminals are shown with voltage protocols above. Activation curves were measured from a HP of either -70 mV or in 4 cases -50 mV following the addition of TTX (1 μm) and TEA (10 mm) to the ACSF. No significant difference was found between these two protocols and so the data were pooled. Control half-activation was -94.4 ± 1.7 mV with a slope of 10.8 mV (n = 3-7; only data points with n > 3 have error bars). In terminals dialysed with cAMP, Ih half-activation was -74.1 ± 2.8 mV with a slope of 8.4 mV (n = 8). This shift in activation results in about half of the current being activated at resting membrane potentials in the calyx.