
Figure 6. Ih has no effect on EPSC amplitude or synaptic depression.
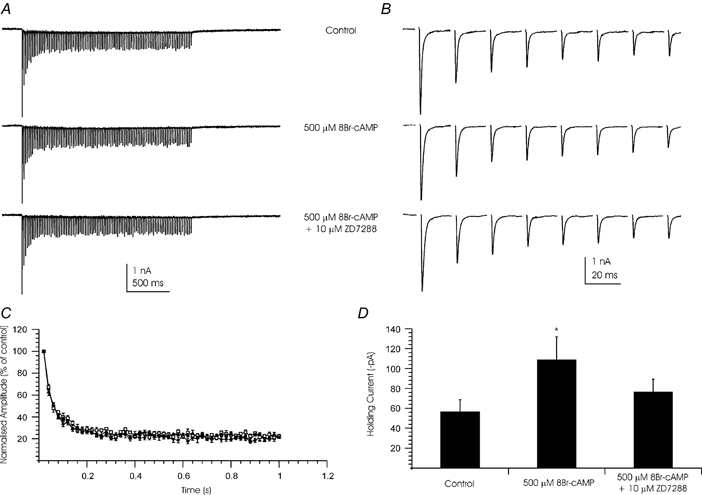
Whole-cell patch clamp recordings were made from MNTB neurones. EPSCs were generated by the calyx of Held in response to a 2 s train of stimuli at 50 Hz. A, traces show mean of 5 sweeps before (top), during 500 μm 8-Br-cAMP (middle) and after perfusion of 500 μm 8-Br-cAMP and 10 μm ZD7288 (lower). B, data trace showing the first 8 EPSCs of the trains shown in A. Steady-state depression is reached by the 6th EPSC of the train. C, plot of EPSC amplitude during the train. Amplitudes were normalised to the peak of the first EPSC of the train. ♦, control; ▪, 500 μm 8Br-cAMP; ▴, 500 μm 8-Br-cAMP and 10 μm ZD7288. Data are plotted as means ±s.e.m. for 4 cells. D, 8-Br-cAMP (500 μm) increased the holding current of the same postsynaptic neurones and this was blocked by ZD7288. Data are presented as mean holding current under each condition (±s.e.m., n = 4). * Statistical difference from control and ZD7288 values (Student's 2-tailed, paired t test; P < 0.05). (Postsynaptic holding potential was -60 mV. EPSC recordings were made in the presence of 1 μm strychnine, 10 μm bicuculline, 50 μmd-AP5 and 10 μm MK-801. Stimulus artifacts have been blanked.)