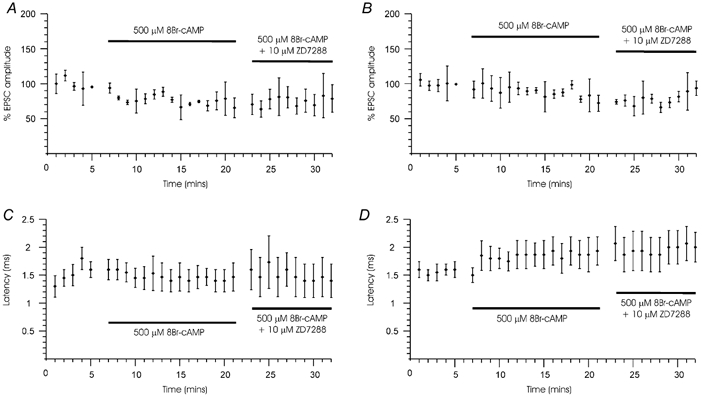
Figure 7. Summary of Ih effects on calyx of Held EPSCs.

Presynaptic axons were stimulated for 2 s once a minute at a frequency of 50 Hz and the postsynaptic MNTB neurone was held at a potential of -60 mV. Means ±s.e.m. (n = 4) are plotted against time for the first (A and C) and 50th EPSCs (B and D) for two parameters: EPSC amplitude (A and B) and EPSC latency (C and D) during application of 8-Br-cAMP and 8-Br-cAMP + ZD7288. Horizontal bars indicate drug application periods. A, effects on the amplitude of the first EPSC in the train. Responses are normalised to the mean amplitude of the first EPSC of all 5 trains during the 5 min control period. B, effects on the amplitude of 50th EPSC (halfway through the train, see Fig. 6). EPSC amplitudes were normalized to the mean amplitude of the EPSC during the 5 control sweeps (minutes 1-5). C, there was no effect on the latency of the first EPSC in the train or (D) on the latency of the 50th EPSC.
