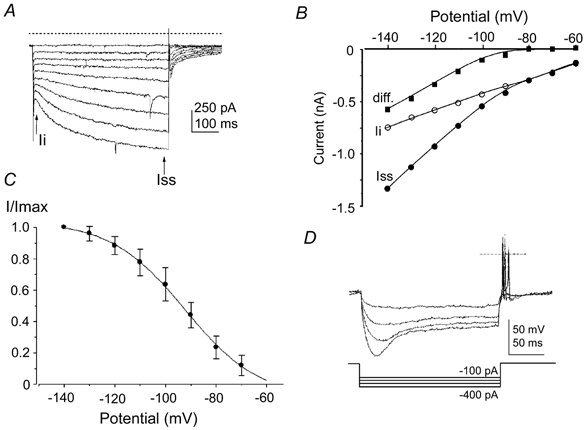
Figure 8. Bushy cells of the aVCN also possess an Ih.

A, inward currents recorded from a bushy cell evoked by 500 ms hyperpolarizing voltage steps from -60 to -140 mV (in -10 mV increments, holding potential was -60 mV). Data are not leak subtracted; dashed line indicates the zero current level and arrows indicate latency of measurements for the current-voltage (I-V) relationship. Ii, instantaneous current; Iss, steady state at 500 ms. B, I-V relationship for the data in A, measured as the difference (▪) between the instantaneous current (Ii, ○) and the current measured at 500 ms (Iss, •). C, the mean Ih activation curve obtained from 15 bushy cells. The normalised tail current magnitude is plotted against the test potential and fitted to a Boltzmann function (continuous line) with half-activation (V1/2) of -94 mV and with a slope factor of 13 mV. Vertical bars are ±s.d. D, a different bushy neurone under current clamp, in response to a 200 ms hyperpolarizing current stimulus. Increasing hyperpolarizing current injection causes a slow time-dependent relaxation of the voltage trace, which can trigger action potentials at the end of the pulse. A dashed line indicates zero voltage level and current steps are plotted below. The resting membrane potential was -58 mV.
