
Figure 9. Bushy cell Ih density increases with animal age.
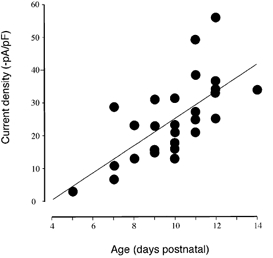
The current density of Ih (-pA pF−1, measured on stepping to a potential of -140 mV) for 27 bushy cells are plotted as a function of animal age. The thin line shows the linear regression of the individual values.