
Figure 2. Rate dependency of 293B-sensitive current (IKs).
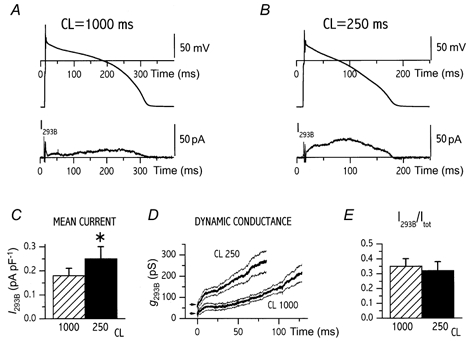
A and B, examples of action potential and I293B recorded at a cycle length (CL) of 1000 (A) and 250 ms (B) according to protocol A; the two CLs were tested within the same cell. C-E, comparison between cycle lengths of 1000 and 250 ms for mean repolarization current density (C), time course of I293B conductance (g293B) during the action potential (dynamic conductance, D) and the ratio between I293B and total repolarizing current (Itot, E). In D, mean traces (thick lines) and their confidence limits (thin lines) are shown; the arrows mark instantaneous conductance. C-E, mean data from 13 cells; *P < 0.05.