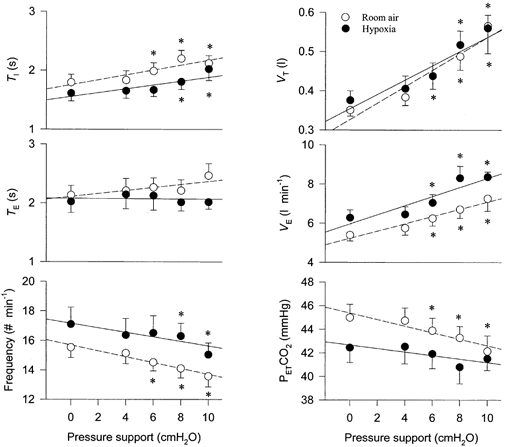
Figure 2. Effect of pressure-support levels on ventilation and respiratory cycle timing during normoxia (○) and hypoxia (•).

The increase of inspiratory pressure support caused an increase in tidal volume and minute ventilation and a decrease in breathing frequency. End-tidal PCO2 gradually decreased. Each point at pressure support levels of 0-8 cmH2O represents the mean data for the entire group of seven subjects. The pressure-support level of 10 cmH2O represents data from all seven subjects during normoxia but only four of seven subjects during hypoxia. During hypoxia, three of seven subjects developed apnoea at pressure support ≤ 10 cmH2O. TI, inspiratory time; TE, expiratory time; VT, tidal volume; , minute ventilation; PET,CO2, end-tidal PCO2. *P < 0.05 compared to the baseline value with zero pressure support.
