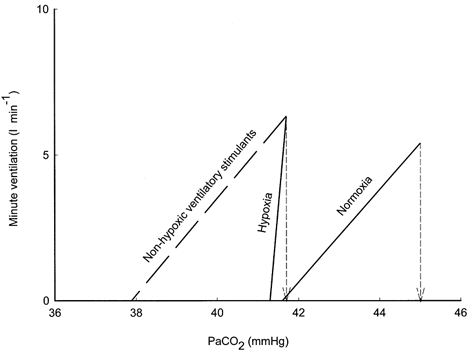
Figure 4. Ventilatory response to CO2 below the eupnoeic PCO2.

The continuous lines were drawn between the point of eupnoeic ventilation at eupnoeic PCO2 and the point of PCO2 at the apnoeic threshold PCO2 using data from the present study during normoxia and hypoxia. The slope of the ventilatory response below eupnoeic PCO2 was greater during hypoxia compared to normoxia. The dashed line represents a hypothetical non-hypoxic ventilatory stimulant that lowered the eupnoeic PCO2 to the same extent as we observed during hypoxia, but did not change the slope of the ventilatory response below eupnoea compared to room air breathing. Note that a much smaller reduction in PCO2 is required to produce apnoea during hypoxia compared to the non-hypoxic ventilatory stimulant.
