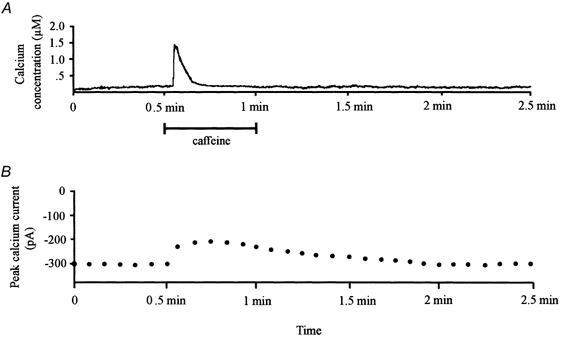
Figure 2. Time course of calcium's effect.

A, time course of the intracellular calcium concentration obtained from an indo-1-loaded catfish cone horizontal cell for a period of 2.5 min; 10 mm caffeine was applied to the cell for 30 s. B, series of data points representing the peak calcium current amplitude obtained over the same time period from the same cell. Calcium currents were elicited using the rampwise stimulus protocol.
