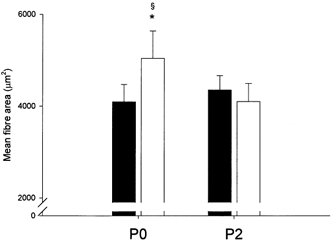
Figure 3. Mean fibre area (MFA).

Absolute values of MFA pre- (▪) and post-resistance training (□) for 12 weeks in the group ingesting protein immediately postexercise (P0, n = 7) and in the group ingesting protein 2 h postexercise (P2, n = 6). * Significantly different from pre-training (P < 0.05); § significantly larger relative increase in P0 than in P2 (P < 0.01). Bars are means ± s.e.m.
