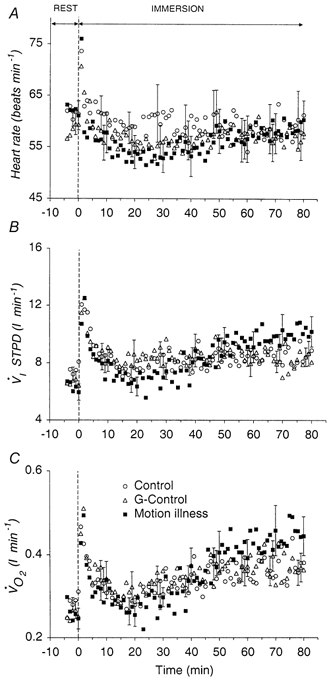
Figure 2.

Mean ±s.e.m. responses of heart rate (HR) (A), minute ventilation  ) (C) during rest (minute 0) and immersion (minutes 1-80) in the three experimental procedures (N = 10). For clarity, the standard error bars are plotted for each procedure at 10 min intervals, commencing with minute -2 for control, minute -1 for G-control and minute 0 for motion sickness.
