
Figure 4. Time- and dose-dependence of the camptothecin effect on conductivity (expressed as percentage of control).
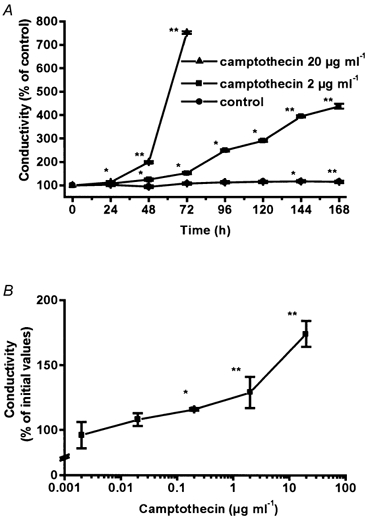
Data represent means ±s.e.m. (*P < 0.05, **P < 0.01). A, time course of untreated cells (from 3.0 to 2.6 mS cm−2 after 48 h, n = 10), and cells incubated with 2 μg ml−1 (from 2.9 to 3.8 mS cm−2 after 48 h, n = 6), or 20 μg ml−1 (from 2.8 to 5.6 mS cm−2 after 48 h, n = 10) camptothecin. B, dose dependency; cells were treated with camptothecin for 48 h. Changes in conductivity are expressed as percentage of initial values (n = 10).