
Figure 8. Correlation of the rate of apoptosis with apoptotic epithelial conductivity and overall conductivity in HT-29/B6 monolayers.
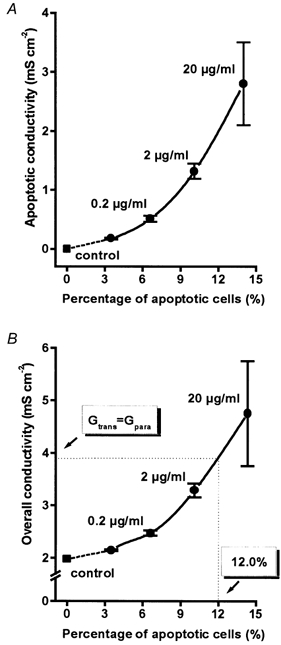
Apoptosis was induced by camptothecin at a concentration of between 0 and 20 μg ml−1 and was quantified as the percentage of apoptotic cells by DAPI staining. Values for 0 % apoptosis were measured in non-apoptotic areas of control monolayers. A, apoptotic conductivity increased exponentially (r2= 0.998, P = 0.001) with the rate of apoptosis, because not only the rate but also the mean conductance of apoptosis increased. B, likewise, overall epithelial conductivity increased with the rate of apoptosis. Under control conditions the paracellular conductivity (Gpara) was smaller than the transcellular (Gtrans), but with 12 % apoptosis, Gpara surpassed Gtrans and, by definition, the epithelium became ‘leaky’.