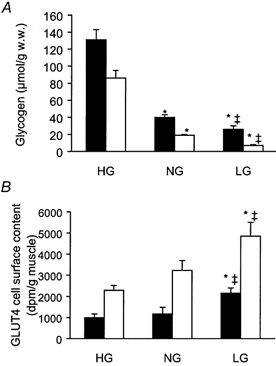
Figure 1. Glycogen content (A) and GLUT4 cell surface content (B) in plantaris muscles at rest (▪) and after contractions (□).

Rats were pre-treated by swimming and diet to obtain muscles with high (HG), normal (NG) or low (LG) glycogen content. Hindlimbs were perfused and the calf muscles of one leg were electrically stimulated (100 ms trains with 2 s intervals) for 10 min. Plantaris muscles were dissected out of the rested and electrically stimulated leg and were incubated in 2-N-4-(1-azi-2,2,2,-trifluoroethyl)benzoyl-1,3-bis(d-mannose-4-yloxy)-2-propylamide (ATB-BMPA) to label cell surface GLUT4. Data are presented as means ±s.e.m. (n = 5-8). * Different from HG (P < 0.05). ‡ Different from NG (P < 0.05). Figure is adapted from Derave et al. (1999) with permission.
