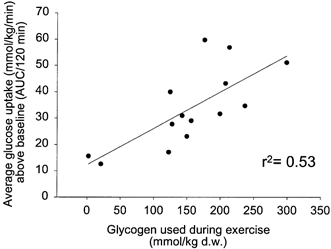
Figure 3. Correlation between the degree of glycogen depletion and the insulin-stimulated glucose uptake in thigh muscles of healthy men.

Subjects performed 60 min one-legged knee-extensor exercise and glycogen depletion was measured as the difference in glycogen content between the rested and exercised leg 3-4 h following exercise. The insulin-stimulated glucose uptake was measured as the area under the curve (AUC) after baseline subtraction for glucose uptake (A-V difference × flow) in the exercised leg during a 120 min hyperinsulinaemic (∼100 μu ml−1) euglycaemic clamp starting 3-4 h post-exercise. n = 14 and r2= 0.53. Data are combined from Wojtaszewski et al. (1997) and Wojtaszewski et al. (2000a).
