
Figure 9. Attenuation of CF EPSCs.
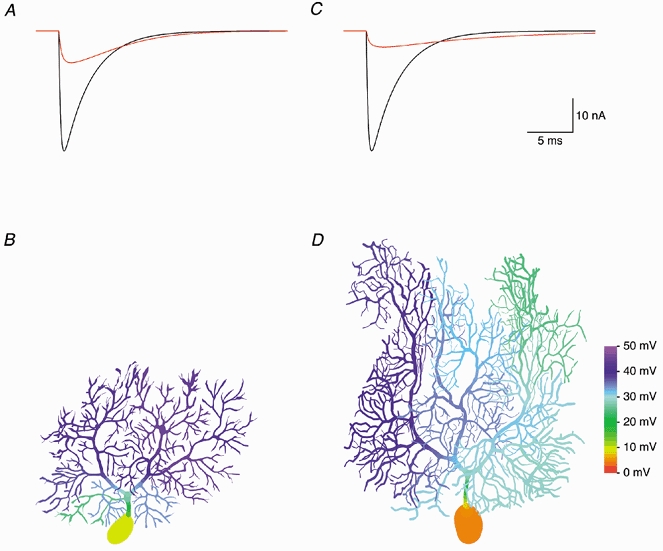
To simulate CF EPSCs, 500 quantal conductances were distributed along the main dendrites (grey region in Fig. 3A) at a constant density per dendritic length and activated synchronously. A, the CF EPSC recorded at the soma of the best-fit passive model of Cell 1 (red trace) is strongly attenuated compared to the EPSC expected under conditions of ideal clamp (black trace). B, colour-coded representation of peak dendritic depolarization during voltage clamp of the CF EPSC. C and D, same as A and B but simulated in the best-fit passive model of Cell 4. Colour bar, 100 μm.