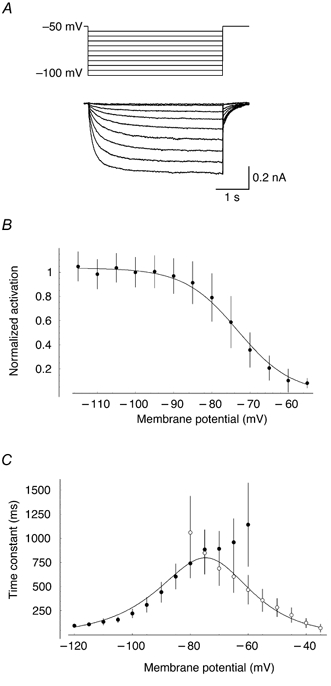
Figure 10. A model of Ih in Purkinje cells.

A, leak-subtracted traces of Ih activation in response to hyperpolarizing current steps from a holding potential of -50 mV. Somatic recording from a P12 Purkinje cell in the presence of TTX (1 μm), CdCl2 (100 μm), 4-AP (1 mm), TEA (5 mm), CNQX (5 μm) and SR 95531 (30 μm). B, steady-state activation of Ih, normalized by driving force (unity at -100 mV; error bars, s.d.). The continuous line illustrates the prediction of the model of Ih (see Methods; a = 0.63 s−1, b = 0.063 mV−1, c = 0.079 mV−1 and V1/2= -73.2 mV). C, kinetics of Ih activation (•) and deactivation (○) at different command potentials. The corresponding curves from the model are superimposed.
