
Figure 11. Attenuation of quantal EPSPs in a P14 Purkinje cell.
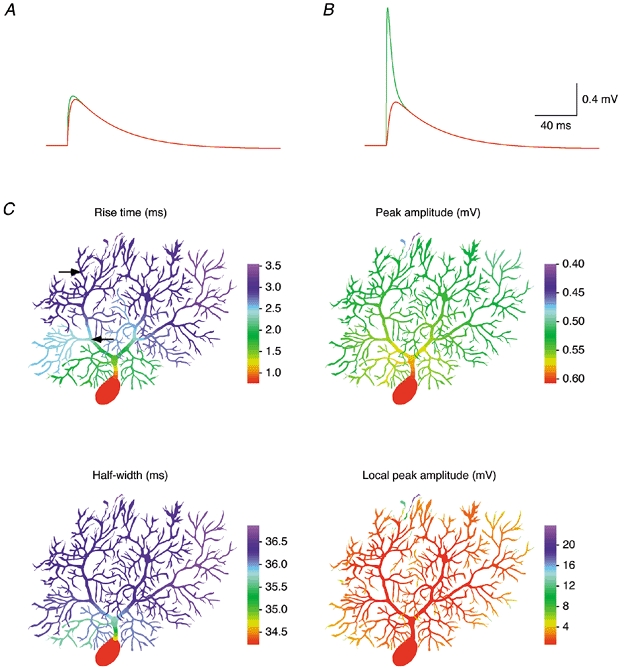
Synaptic potentials were simulated in a model of Cell 1 including Ih (see Methods). A, subsynaptic EPSP (green trace) and somatic EPSP (red trace) simulated for the synaptic location indicated by the proximal arrow in C. B, same as A but simulated for the synaptic location indicated by the distal arrow in C. C, colour-coded representation of the 20-80 % rise time, peak amplitude and half-width (full width at half-maximum) of the EPSP recorded at the soma, as well as the local EPSP amplitude for synaptic locations simulated successively in each dendritic compartment of Cell 1. Colour bars, 100 μm.