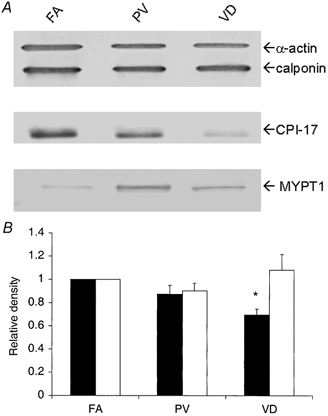
Figure 3. Relative expression of α-smooth muscle actin, h-calponin, CPI-17 and MYPT1.

Contractile proteins from three rabbit smooth muscle tissues (FA, femoral artery; PV, portal vein; and VD, vas deferens) were probed. For α-actin and h-calponin, 1.25 μg of total protein was subjected to SDS-PAGE and Western blotting (upper lane in A). For anti-CPI-17 (middle lane) and anti-MYPT1 (lower lane), 25 μg of total protein was used. In B, filled bars are staining intensity for α-actin and open bars are for h-calponin. The densities for the FA were set to 1 and the relative densities for the PV and VD are plotted (n = 4). * Significant difference from the value for FA.
